ISFIS strives to help school leaders and others understand the Iowa School Finance Formula. More details are available for ISFIS Finance Subscribers under the Finance Subscriber tab, but below is general information on key terms and concepts we hope will benefit anyone interested in learning more about how public schools in Iowa are funded.
Introduction to Iowa School Finance Video
This 20-minute video by Ken Sturgis provides a general overview of the Iowa school finance formula and various school finance issues affecting public school districts. This Iowa School Finance Basics Video and the Accompanying PowerPoint Slides can be shared with school board candidates, legislators, district staff, posted on a school district website, or circulated to others interested in Iowa public school finance issues. This video is intended to be an overview and a basic introduction. (Updated Fall 2025)
A more detailed video and additional school finance resources are available for ISFIS Subscribers (login required). For questions on Iowa school finance issues, contact us.
View a historical (2023) version of this overview of Iowa school finances by ISFIS Founder, Larry Sigel: Iowa School Finance Basics Video and the Accompanying PowerPoint Slides. (Created 2023)
Key Measures of Financial Health
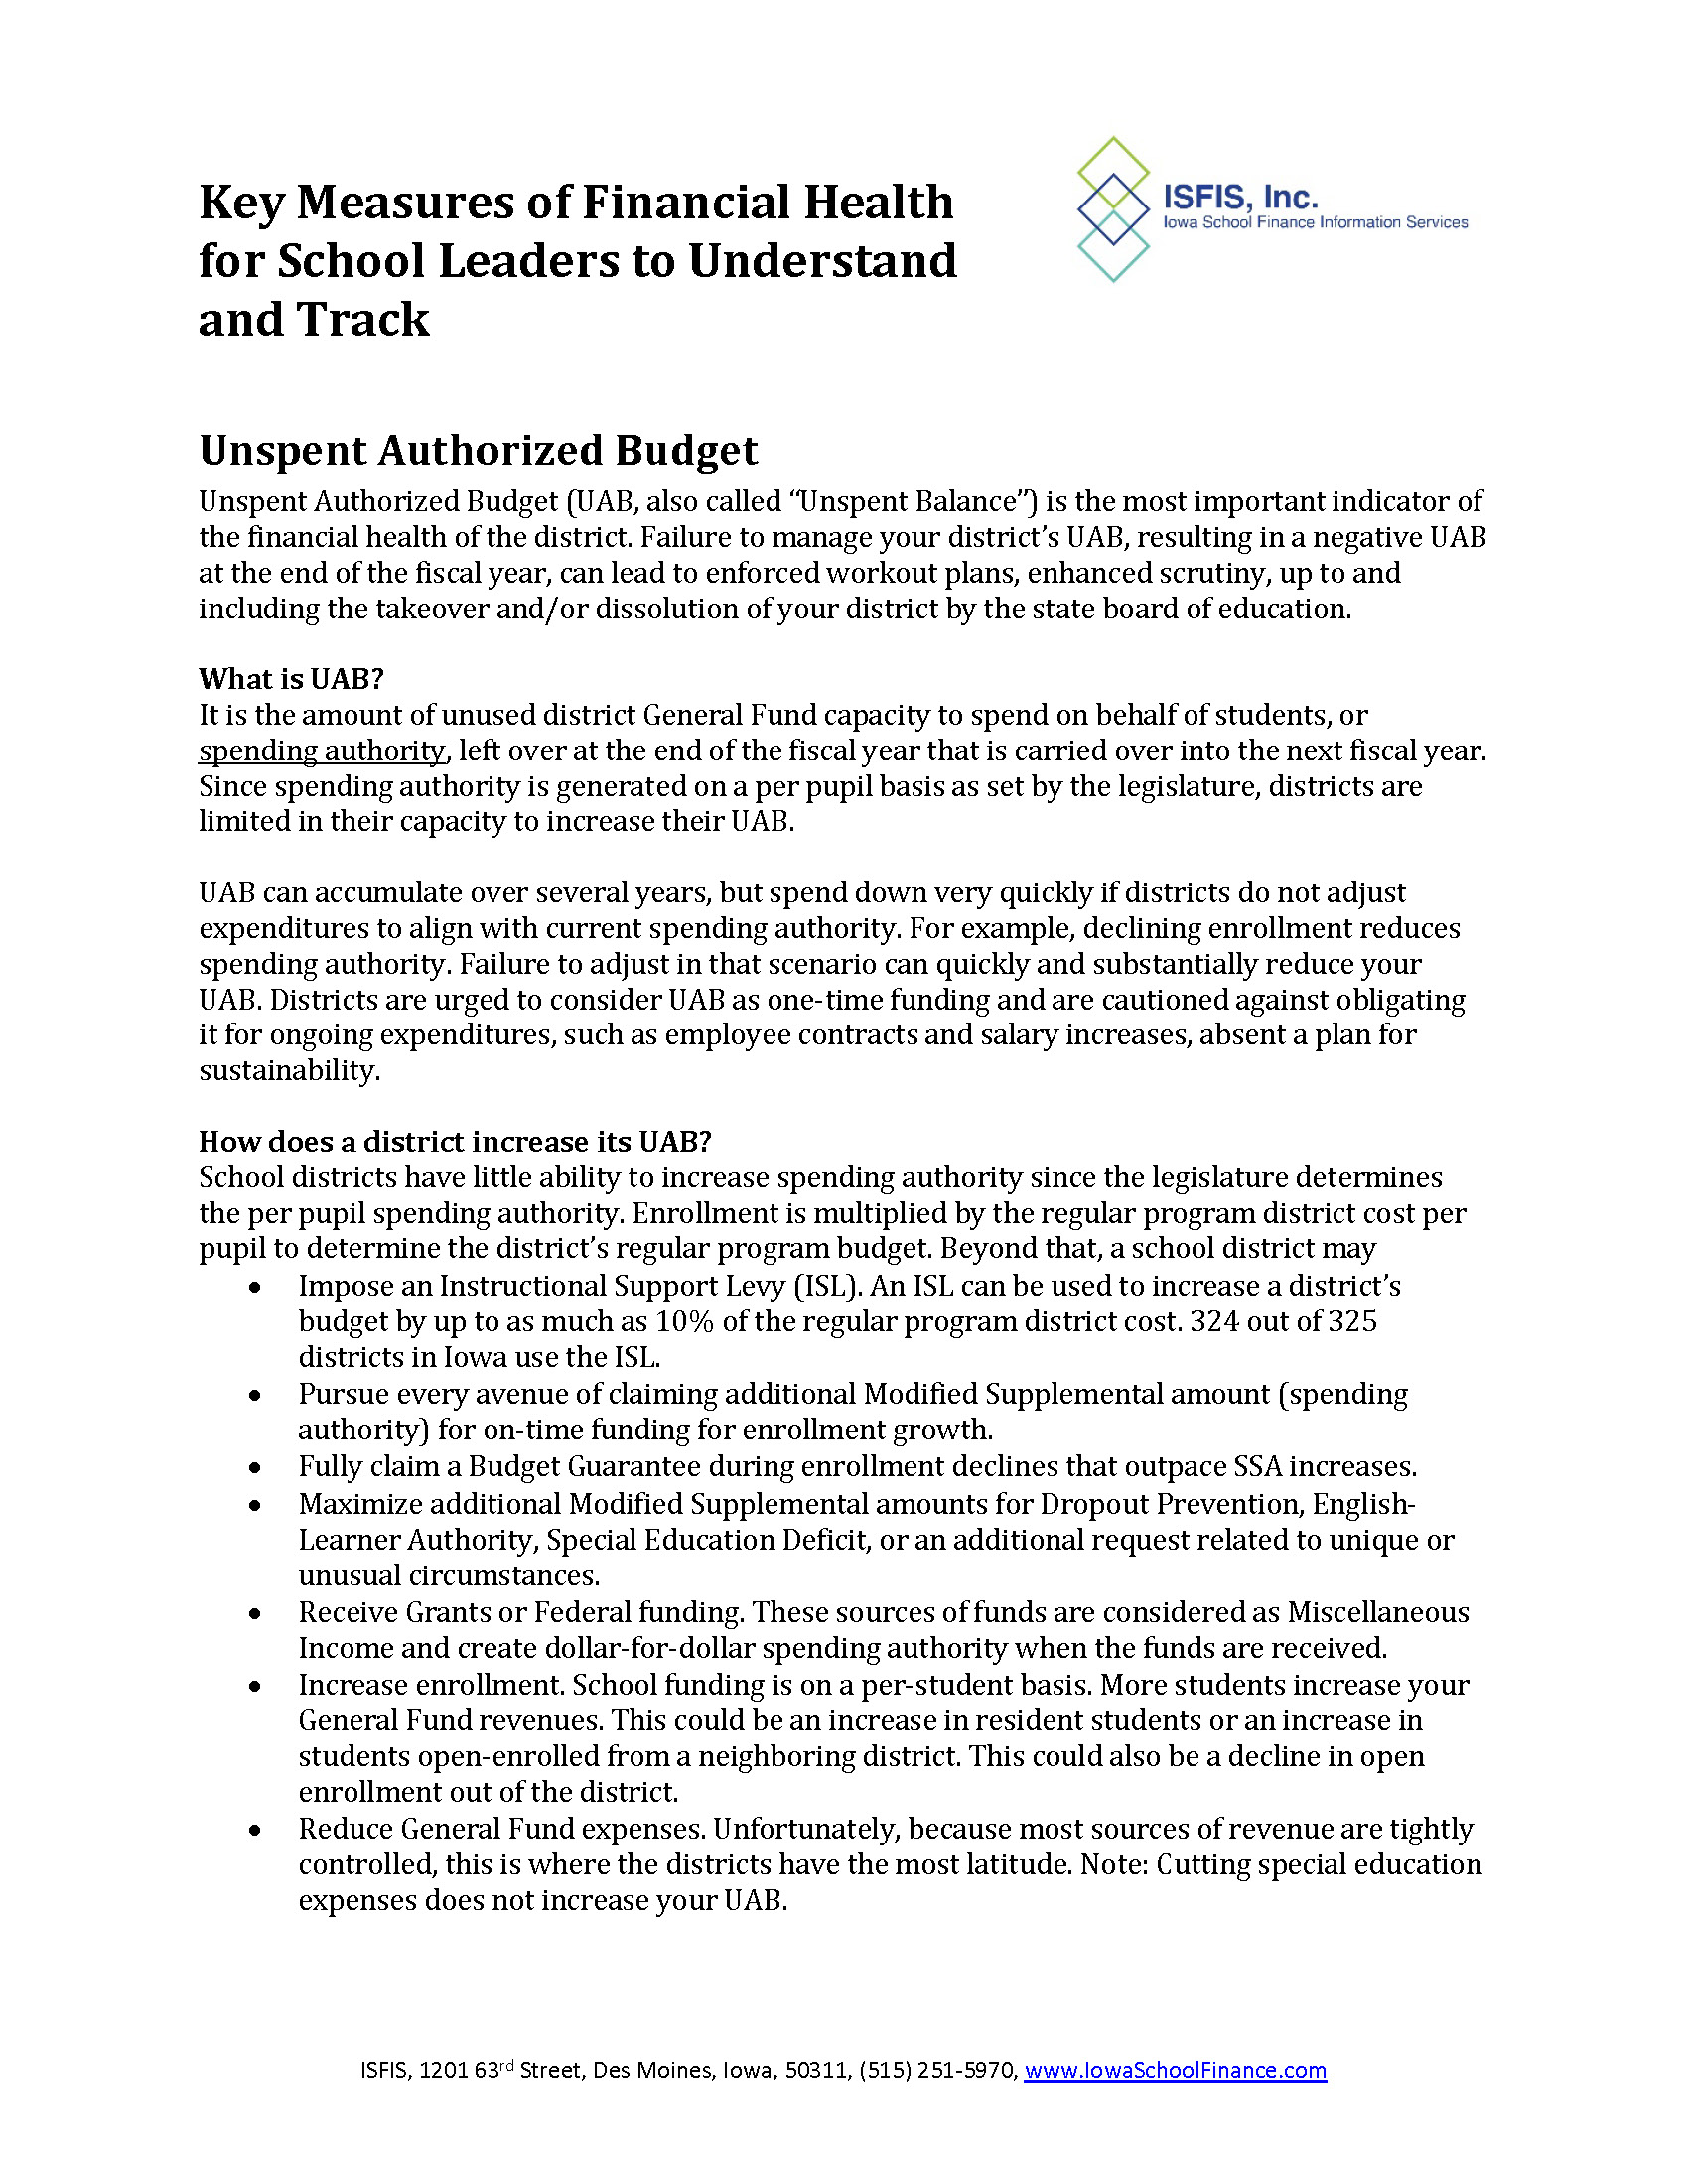
Below is a link to a number of key terms, definitions, and measures of a school district’s financial health. This document discusses Unpent Authorized Budget (UAB), including the definition, targets, the difference between cash and spending authority, and impacts on UAB. It also discusses Solvency Ratio calculations and targets, Enrollment Trends, Staffing and Building Ratios, New Money or New Spending Authority, Budget Guarantee, and school finance ideas to keep in mind, Download this printable version of the Key Measures of Financial Health here, pictured below. (Updated 2026)
Graphic Diagram of School Finance
Pictured below is the ISFIS School Finance Graphical Diagram, which visually displays the funding sources and allowable expenditures under each school district fund.
While not all-encompassing, this diagram is an excellent tool for posting on local district websites, sharing with new board members or those running for public office, or using when talking with legislators.

Poverty - Free and Reduced Percentages by School District FY 2001 - FY 2024
View this PPT on poverty in Iowa, with maps showing the free and reduced-price percentages by school district for each year from FY 2001 through FY 2024 from the ISFIS Interactive Mapping Tool.
More School Finance Videos, Presentations, and Related Topics
- "What Urban Leaders need to know about Iowa School Finance" - This ISFIS Webinar was recorded in December 2019 and designed especially for urban school district leaders. View the Dec 2019 Webinar Recording or download the Accompanying PowerPoint.
-
Financing Public Education in Iowa, 2017 - This document provides detailed explanations by the Department of Education on Iowa school funding history dated 2017, however, it predates local control expansions adopted by the Iowa legislature in 2017 and more recent legislative sessions.
Questions
ISFIS is here to answer more in-depth questions on related school finance questions. Contact us with questions on topics such as:
- Iowa’s Property Tax System
- Funding Special Education
- Spending Authority
- Budget Guarantee
- Data, Ratios, and Trends
- And more